
Cloud computing and AI are expanding what can be done with diagnostic information. But Persodia’s reconstruction of the 2025 market finds that around 72% of today’s Diagnostic Informatics revenue still lies in Laboratory Operations.
Diagnostic Informatics has rarely attracted as much attention as it does today.
Cloud computing has changed what can be connected, deployed and scaled. Artificial intelligence is opening new possibilities for working with diagnostic data. Digital pathology, genomic interpretation, clinical algorithms and other applications are bringing new technologies and companies into a field once associated mainly with LIS, connectivity and laboratory middleware.
We wanted to understand what the market actually looks like today.
Persodia mapped 16 commercial software markets around the production, management, interpretation and use of diagnostic information. Together, we estimate they represented approximately US$7 billion in global vendor revenue in 2025, with a working range of roughly US$6–8 billion.
That is already equivalent to approximately 5% of Persodia’s estimate of the global Diagnostics market.
But the more interesting finding was not the total.
It was where the money is.
Most of the market remains close to laboratory operations
Approximately 72% of Diagnostic Informatics revenue — around US$5 billion — is associated with Laboratory Operations.
LIS alone represents approximately US$2.6 billion. Middleware adds around US$0.9 billion. POC data management, quality and compliance, laboratory analytics, outreach connectivity, revenue-cycle applications and pathology reporting account for much of the remainder.
These systems perform some of the fundamental information functions of laboratory medicine: managing orders and samples, connecting instruments, coordinating workflows, assuring quality, moving information and delivering it where it is needed.
They remain the economic centre of Diagnostic Informatics.
But another layer is clearly visible.
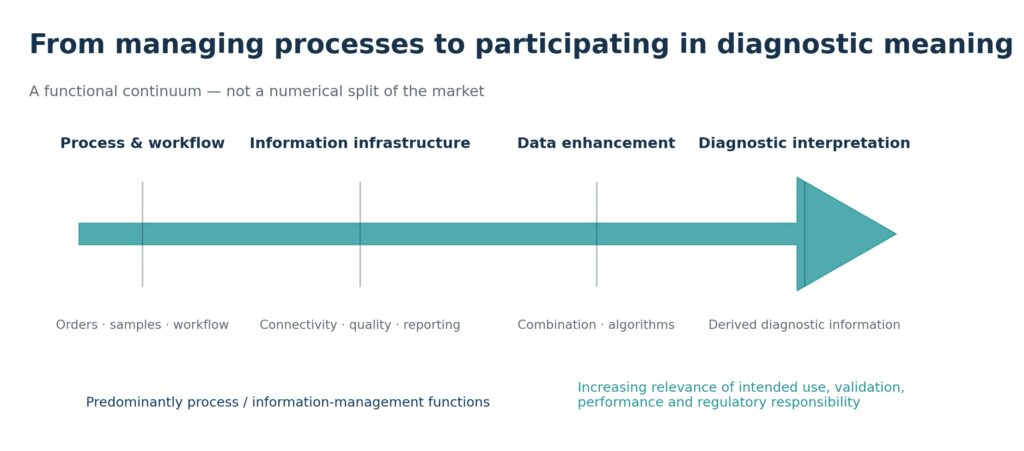
Software can operate on the diagnostic data itself: interpreting measurements and images, combining information, applying algorithms and transforming analytical data into richer diagnostic information.
We estimate these Diagnostic-Information applications at approximately US$1.6 billion, or 23% of the total. They include digital pathology, genomic and molecular interpretation, diagnostic algorithms and decision support, and cell and image analysis.
Both layers are part of laboratory operations in the broad sense. The distinction is what the software is operating on.
One predominantly manages the processes and information infrastructure through which Diagnostics works. The other increasingly participates in what diagnostic information becomes.
Today, the first is still more than three times larger.
The 2025 Diagnostic Informatics market
The estimate covers commercial software markets whose primary economic value lies in managing, processing, interpreting or extending the use of diagnostic information. Device-integral software that is not separately commercialised, captive internal tools and general implementation or professional services are excluded. Estimates combine published market evidence with company-, product- and application-level reconstruction; individual categories therefore carry wider uncertainty than the central figures may suggest.
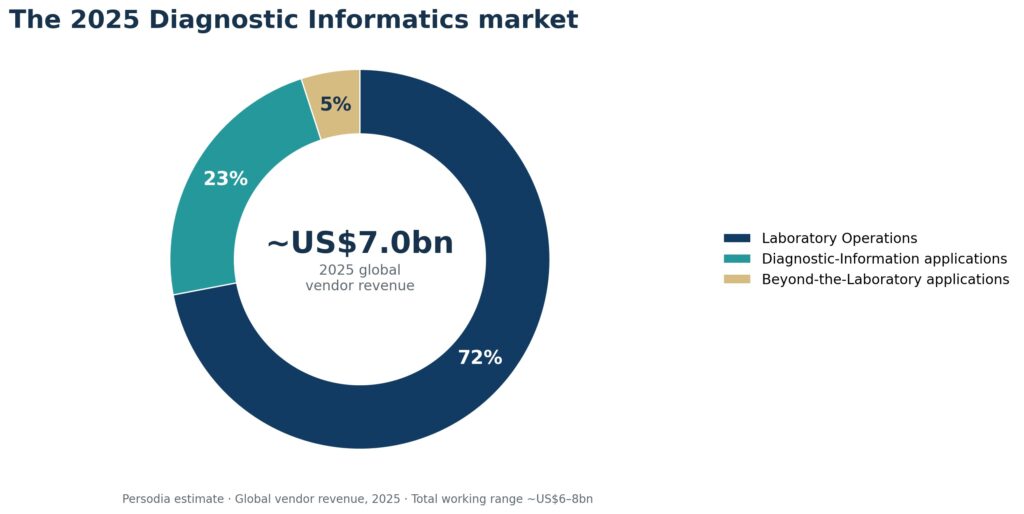
| Market layer | Estimated 2025 revenue | Share |
|---|---|---|
| Laboratory Operations | ~US$5.0bn | ~77% |
| Diagnostic-Information applications | ~US$1.6bn | ~17% |
| Beyond-the-Laboratory applications | ~US$0.4bn | ~5% |
| Total Diagnostic Informatics | ~US$7.0bn | 100% |
Persodia estimate. Global vendor revenue, 2025. Public working range for the total market: approximately US$6–8 billion.
The underlying markets tell the same story
Looking below those three layers makes the distribution even clearer.
The largest individual market is still LIS. Middleware is second. Several of the areas receiving much of today’s technological attention remain substantially smaller in current revenue.
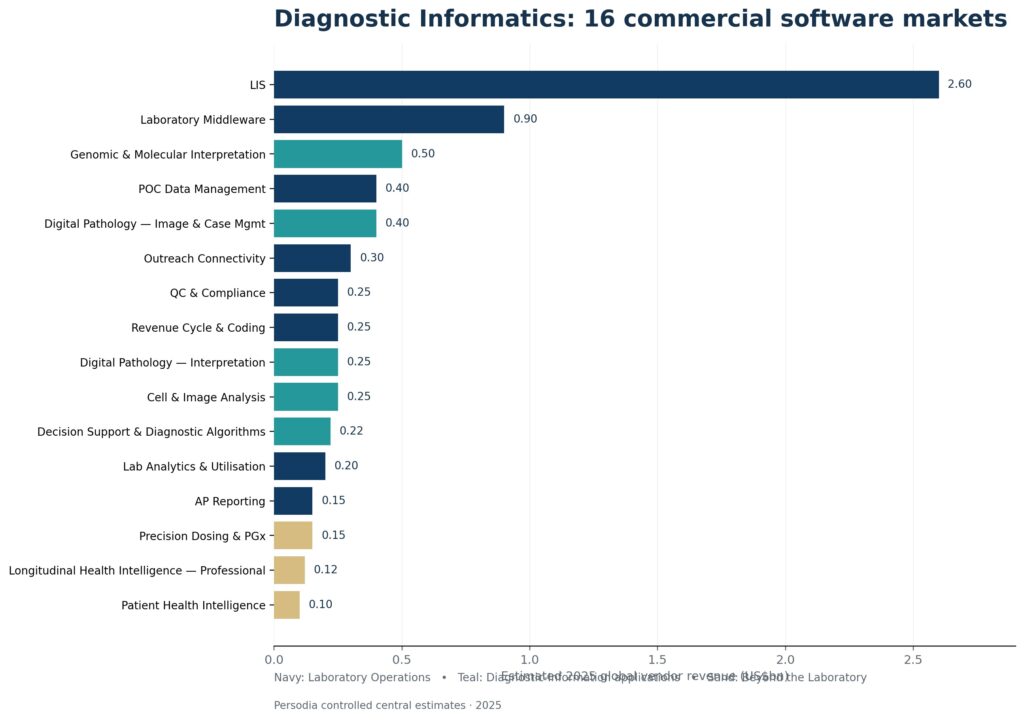
| Diagnostic Informatics market | 2025 estimate, US$bn |
|---|---|
| Laboratory Information Systems (LIS) | 2.60 |
| Laboratory Middleware | 0.90 |
| Genomic & Molecular Interpretation | 0.50 |
| POC Data Management | 0.40 |
| Digital Pathology — Image & Case Management | 0.40 |
| Outreach Connectivity | 0.30 |
| QC & Compliance | 0.25 |
| Revenue Cycle & Coding | 0.25 |
| Digital Pathology — Interpretation | 0.25 |
| Cell & Image Analysis | 0.25 |
| Decision Support & Diagnostic Algorithms | 0.22 |
| Lab Analytics & Utilisation | 0.20 |
| AP Reporting | 0.15 |
| Precision Dosing & PGx | 0.15 |
| Longitudinal Health Intelligence — Professional | 0.12 |
| Patient Health Intelligence | 0.10 |
Figures are controlled central estimates rather than reported market totals. Categories have individual working ranges and should not be interpreted as point-precise measurements.
This is where the contrast with the current conversation becomes particularly visible.
AI, computational pathology, genomics and advanced interpretation attract attention because of what they may make possible. Yet the current market remains dominated by the systems required to produce, manage, qualify and deliver diagnostic information reliably every day.
That infrastructure may receive less attention. Economically, it remains fundamental.
Moving closer to diagnostic meaning changes the software
There is another difference as software moves from managing processes around diagnostic data toward operating on the data itself.
A system that routes orders, connects an analyzer or manages workflow performs a different function from software that derives a clinically relevant classification, interpretation or quantitative assessment from diagnostic data.
The regulatory boundary is not absolute. Regulated and non-regulated products coexist across the landscape, and regulatory status ultimately depends on intended purpose and the applicable jurisdiction.
But the direction is important.
As software participates more directly in generating diagnostic information, questions of intended use, validation, performance, analytical context and regulatory responsibility become increasingly consequential.
This makes the transition toward interpretation more than a technological progression. It changes what the software is responsible for.
Three industries are meeting around diagnostic information
The supplier landscape adds another dimension.
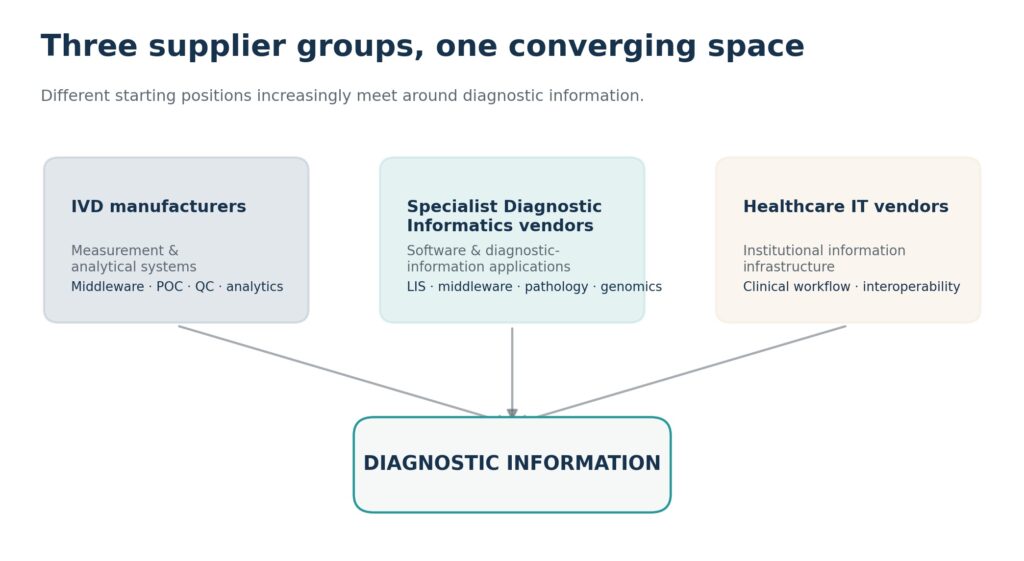
We see three broad groups operating across Diagnostic Informatics:
| Supplier group | Starting position | Typical areas of participation |
|---|---|---|
| IVD manufacturers | Measurement, analytical systems and laboratory workflow | Middleware, POC management, QC, laboratory analytics and selected interpretation applications |
| Specialist Diagnostic Informatics vendors | Software and diagnostic-information applications | LIS, middleware, pathology, genomics, algorithms, decision support and specialised applications |
| Healthcare IT vendors | Institutional information infrastructure and clinical workflow | Laboratory information, interoperability, clinical workflow and integration with the broader patient record |
Their origins are different.
IVD manufacturers approach informatics from the measurement and analytical system. Specialist vendors approach it from software and particular diagnostic-information problems. Healthcare IT companies approach from institutional information infrastructure, clinical workflow and the broader patient record.
Increasingly, however, they meet around the same thing:
diagnostic information.
The current market has a clear shape
The approximately US$7 billion figure establishes that Diagnostic Informatics is already economically meaningful — equivalent to around 5% of Persodia’s estimate of the global Diagnostics market.
But the distribution tells us more than the total.
At a time when much of the conversation concerns AI, algorithms and advanced interpretation, most of the current economic value remains in the fundamental information infrastructure of Diagnostics.
At the same time, new technologies, applications and specialist companies are increasingly visible around the diagnostic data itself.
This is a snapshot, not a growth study. It does not tell us how quickly one layer is expanding relative to another.
It does show where Diagnostic Informatics stands today.
The conversation is increasingly about what more we can do with diagnostic information. The revenue, today, is still predominantly in the infrastructure required to produce, manage and deliver it.
What comes next?
That observation led us to a different question.
We went beyond the supply-side market map to consider what laboratories and healthcare systems need from diagnostic information, which needs are becoming more important, and where new digital capabilities could create additional value.
That changes the question from what the Diagnostic Informatics market is today to what role Diagnostics can play as more value is created from diagnostic information.
It also introduces responsibility alongside opportunity. As software moves closer to interpretation and diagnostic meaning, validation, analytical context, accountability and preservation of diagnostic meaning become harder to separate from the commercial opportunity.
Those questions are the subject of the accompanying Persodia Insight: From Measurement to Meaning: Where Should Diagnostics Go Next?
Links:
5 Signals from HLTH Europe That Reveal Diagnostics’ Next Challenge
Healthcare as Seen at HLTH Europe 2026
IVD Industry Monograph No. 4 – Beyond the Data Feed: Diagnostic Contribution in Health Intelligence